
Calculating and Optimizing Creative Attention Windows
Time: ~15 minutes
Difficulty: beginner
What you’ll learn
Attention in advertising is vital. In this exercise you will learn how to calculate and optimize the Creative Attention Windows of 2 seconds and 5 seconds with your Brainsights Data Package.
Background
Value
Case in point
Calculate Attention Windows and Optimize Creative Attention with your Brainsights Data Package (using Excel).
In this example, we will use the Olympics Data Package.
Considerations and Additional Ideas
Background
When an ad appears in our view or feed, our brain gets to work in the background figuring out whether it wishes to expend the time and energy it predicts needing to view and process the information in the video.
These mechanisms happen under the radar before bubbling up into our conscious mind and resulting in a behaviour: watch, or skip.
The speed with which consumers make these unconscious decisions also varies by the platform on which the video is being viewed, which are based on the expectations of consumers within those environments. On TikTok, for example, media can be purchased on 2 seconds of viewing and on YouTube, an ad can be skipped after 5 seconds. We can therefore deduce that these Attention Windows (2 seconds for TikTok and 5 seconds for YouTube) are vital for these platforms.
In other words, you have this amount of time to make a meaningful impact before you’re swiped away.
More broadly, and irrespective of particular media, our brains love to be energy optimizers. So there’s a sort of gravitational pull towards a consumer resting state that advertising also fights against to ensure its capturing the attention of consumers.
So, from a media and neurological perspective, these factors make the Hook arguably the most important part of an ad: What brands do in the opening moments of their video advertising often makes or breaks the success of their ad, as we’ll see in the following sections.
Here, you’ll learn how to calculate Creative Attention Windows using Brainsights data, and use these Creative Attention Window calculations to improve the impact of your storytelling.
Value
Nailing creative attention is critical in today’s multi-channel, multi-platform video media world. A growing body of research points to the benefits of Attention, defined largely as human media viewability using eye-tracking technology and AI.
But don’t sleep on the Attention intrinsic to your brand’s creative: you have much more control over it, and creative quality has proven, time and again, to be the biggest driver of advertising profitability. Creative Attention is critical to this.
Understand the Attention properties intrinsic to creative and it can be adapted to ensure an ad hooks consumers across a range of media environments.
Brands that understand and exploit these properties capture Attention hook consumers powerfully with their video creative, and in turn enjoy longer view times and engagement, as well as better brand and business outcomes.
Case in point
The following are the Creative Attention Curves of a software brand, which released a series of 3-4 minute videos on YouTube and Facebook, and the Creative Attention Curve of a recent bank ad, released primarily on TV/CTV.
This shows the second-by-second Neural Engagement (a composite score comprising Attention, Emotional Connection and Memory Encoding) versus consumer baselines, in addition to the average Neural Engagement for the 2 seconds and 5 seconds Attention Windows. Both were screened for the same sample audience composition, about two months apart.

For the fintech brand, the campaign attributable benefits of strong creative attention were longer video retention, and much stronger ad breakthrough, recall and brand consideration than average. For the bank brand, the cost of poor creative attention were significantly below norm breakthrough, recall and branding as reported by the brand’s tracker.
Calculate Attention Windows and Optimize Creative Attention
Step 1: Open the csv entitled “data” from your Brainsights Data Package
Step 2: Apply a filter to the headers, and, in the Start column, select the first 5 seconds (0:00, 0:01, 0:02, 0:03, 0:04). This will produce the first 5 seconds for each ad in the package (see image).

Step 3: Select cells I2:K2301 – This will give you your First 5 seconds Creative Attention Window Average. This is the Neural Engagement (Attention, Connection, Encoding) average for the first 5 seconds across all ads in the dataset. In other words, this is your 5 seconds Creative Attention Window.
For the Olympics Data Package, this value will equal +13%. That means that the average Neural Engagement in the first 5 seconds of Olympics advertising is +13% greater than the average Neural Engagement across all the Olympics advertising.

Step 4: For a 2 seconds Creative Attention Window, repeat Steps 2 and 3, but in Step 2, select the first 2 seconds in the Start column filter (0:00, 0:01). You should then have your average of +17% for the Olympics Data Package.
Understand how to Optimize your Creative Attention Window
Calculating your creative attention window now gives you the basis for optimization. That is, understanding the key practices and principles to deploy to maximize your creative’s chances of Attention success.
The next step in this process is to understand what characterizes top-performers in Creative Attention.
To do so, you will need to generate the performances of each individual ad, and then look for patterns in the stimuli and creative approach of the top performers, and how these compare to the bottom performers.
Let’s return to the Olympics Data Package example.
You will need to calculate the average Neural Engagement of the first 2 seconds, and first 5 seconds of each ad, and compare these to average first 2 seconds and first 5 seconds of the total, providing us with a Creative Attention distribution that looks like this:

Attention Distribution (2 seconds)

Attention Distribution (5 seconds)
Now for the fun part
Let’s optimize Creative Attention. Open the content.csv file in your Brainsights Data Package. Inside you will find links to the corresponding videos for which there is consumer neuroscience data.
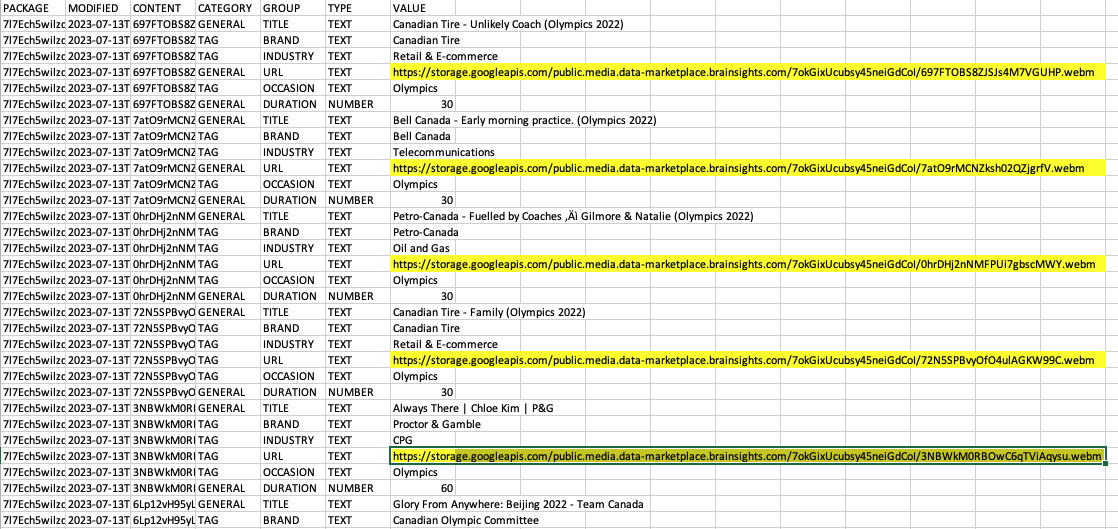
The content links for the Olympics Data Package are highlighted in yellow.
Open these up in your favourite web browser (Chrome, for example) and explore the opening few moments of each to investigate patterns, relating these to the performance of the creative.

Here’s what we produced for the top-performing hook for both the 2 seconds and 5 seconds Creative Attention Windows using the Skip the Dishes Mark McMorris spot.
Now you are on your way to improving the Attention of your Creative across vital Attention Windows.
Some things to consider
Pay attention to the Data Collection Period. Seasonality and topicality matter for Attention.
Example: RBC’s An Idea Whose Time Has Come was screened twice for consumers, once in July 2021 (during the postponed Tokyo 2020 Olympics) and another time in November 2021. The Attention data is different, which can be attributed to the lack of social-contextual relevance of the message.
Seemingly small changes can yield big differences
Example: Skip The Dishes used Mark McMorris and Marie-Philip Poulin in very similar ways, but yield Attention differences of 5-10 percentage points. Success can be influenced by talent, craft, sound, and other seemingly small factors.
Additional thoughts
Calculate Creative Attention Windows by Olympics to understand how Hook effectiveness changes by Summer/Winter Olympiad.
Calculate Creative Attention Window Performance by Brand, year over year, to understand if and how your brand is improving.
Purchasing data from Brainsights
We have datasets available to buy on our store, with more on the way soon. If you’re interested in data that isn’t in one of our packages, check out our Data Subscription.